
Log sync is not enabled for the project. Check the project status under Logs → View.
Logs explorer
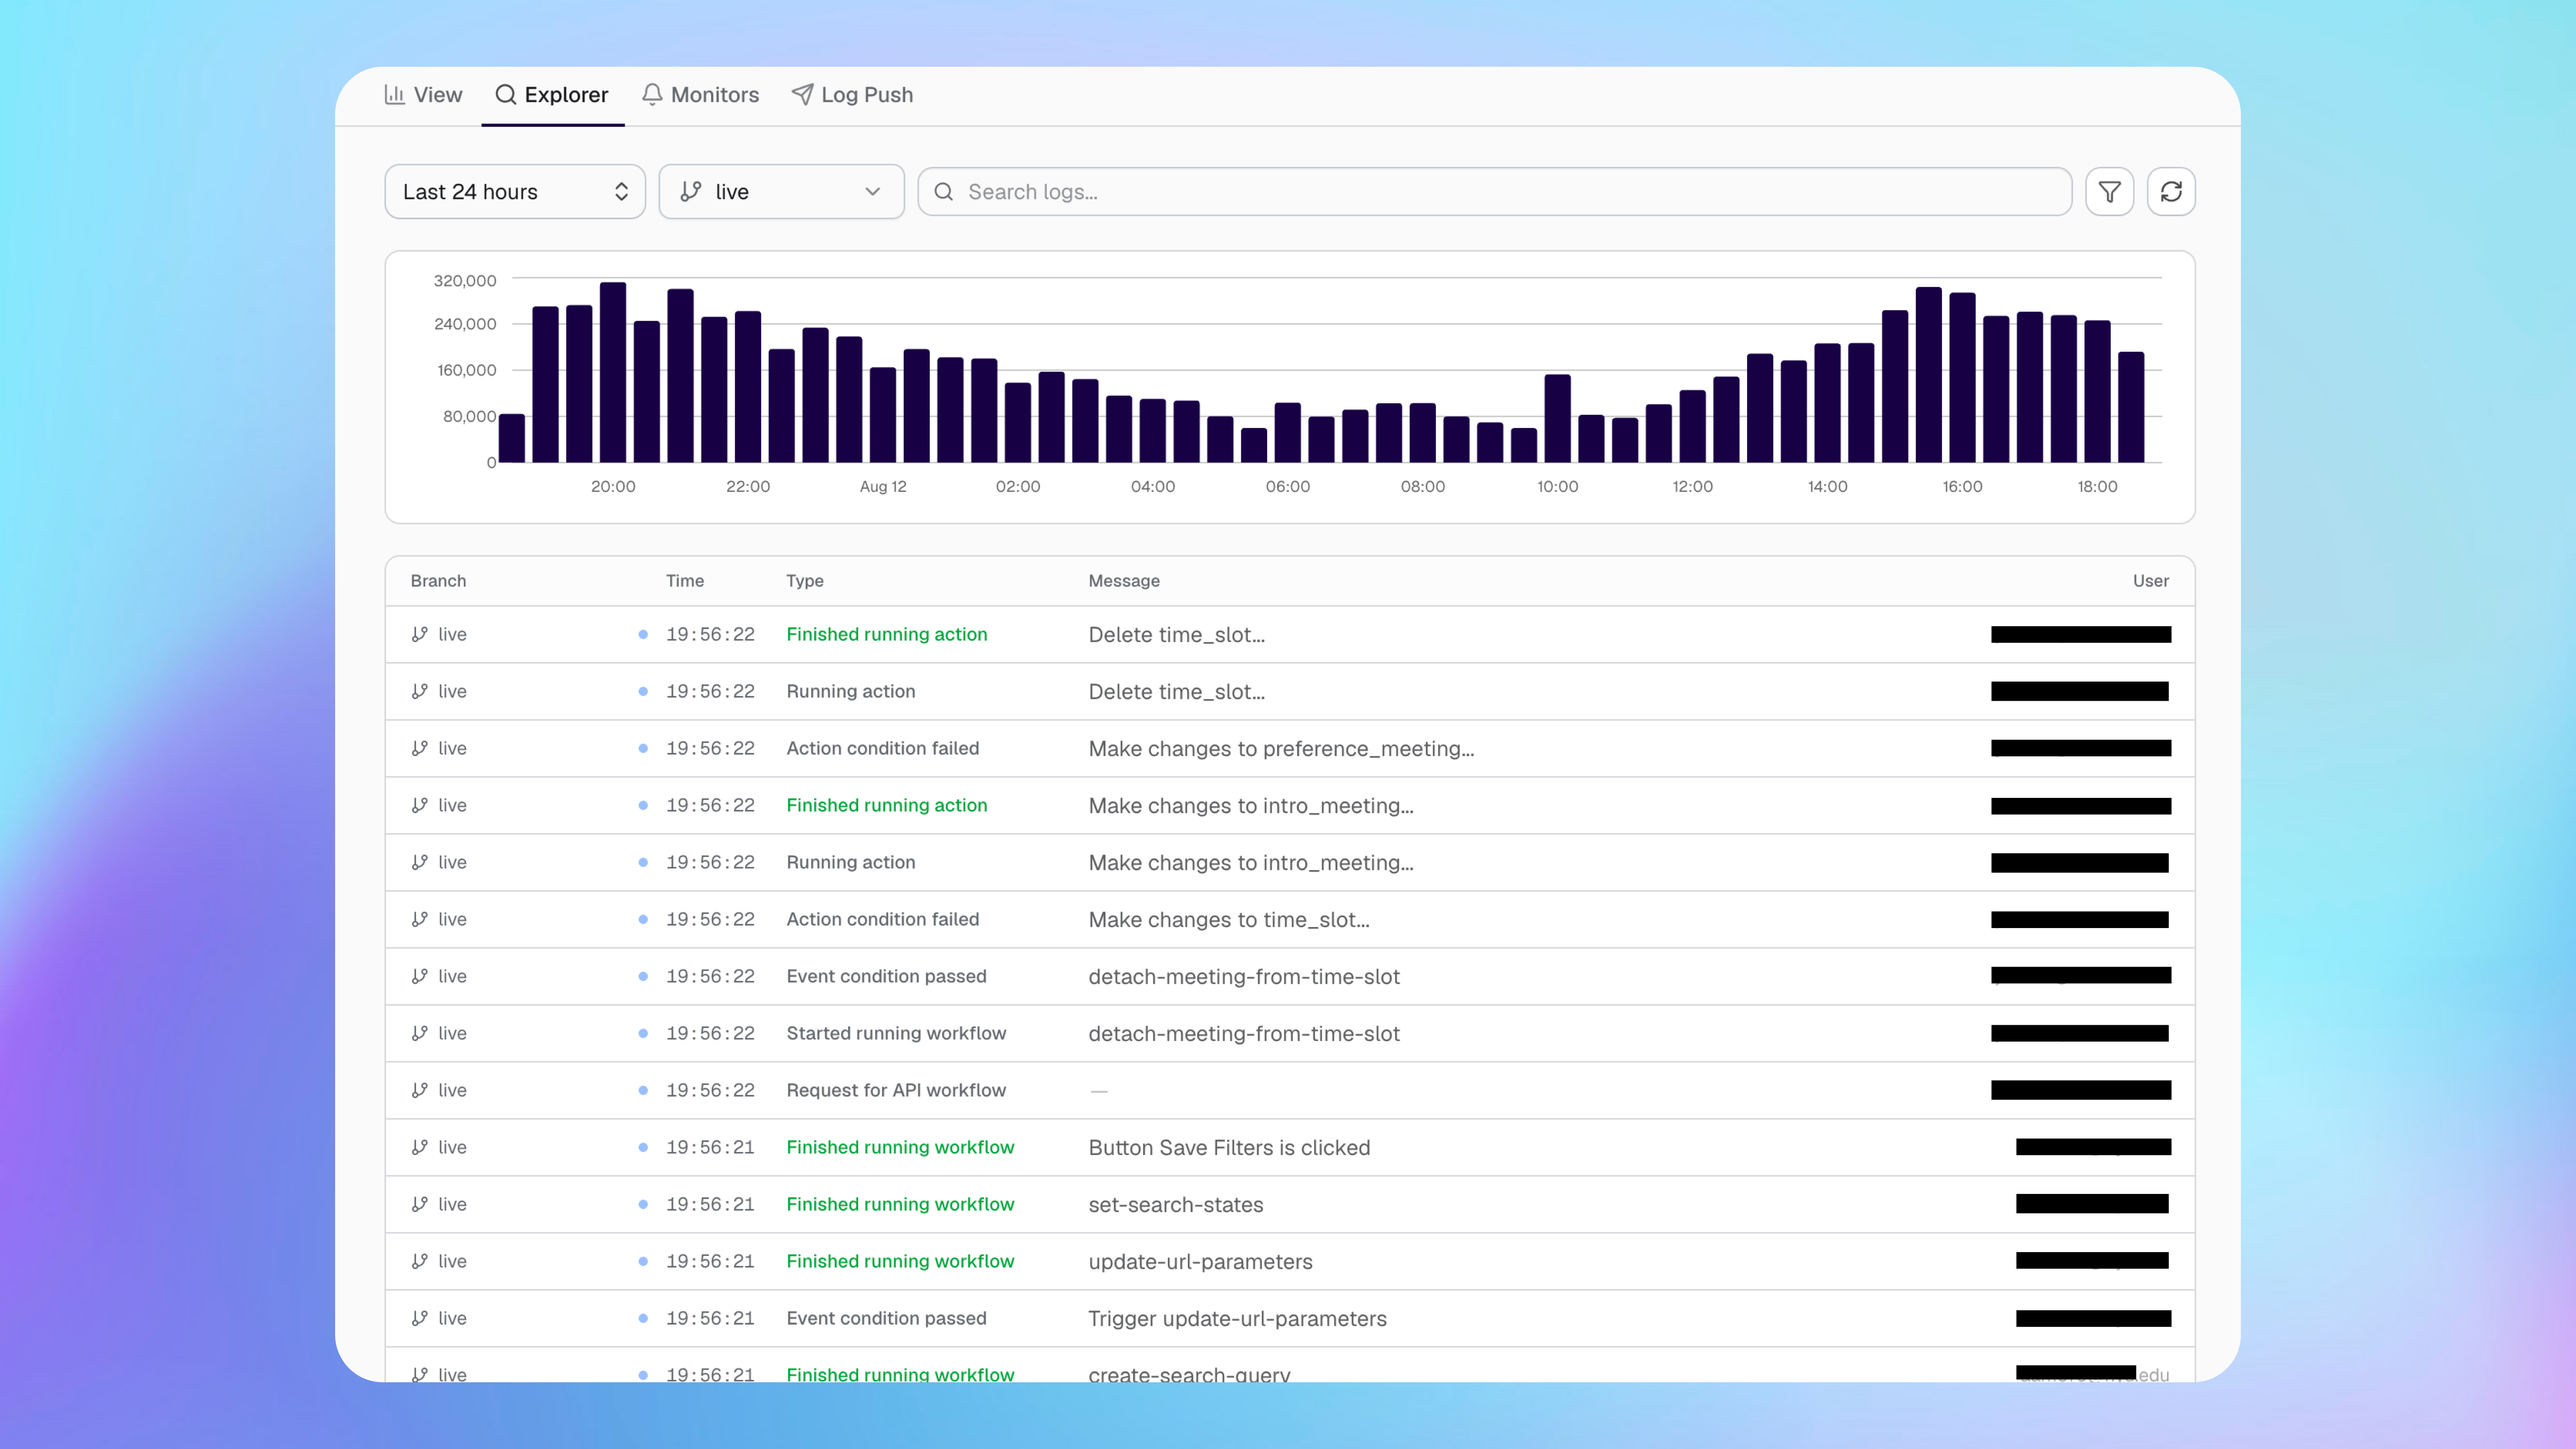
Use Logs explorer to find individual Bubble events, investigate errors, and follow the actions in a workflow.
Find relevant logs
Choose the smallest useful time range and Bubble version before adding more filters.
You can filter by:
Search text from the log message.
Bubble event type.
User email.
Bubble Thing ID.
Pasting a Thing ID into search can add it as a filter automatically. Click a bar in the volume chart to zoom into that period.
Understand the results
Each result shows the Bubble branch, time, event type, message, and user when available.
Event types include workflow starts and finishes, actions, failed conditions, errors, plugin events, scheduled tasks, API workflows, HTTP activity, and failed emails.
Inspect a log event
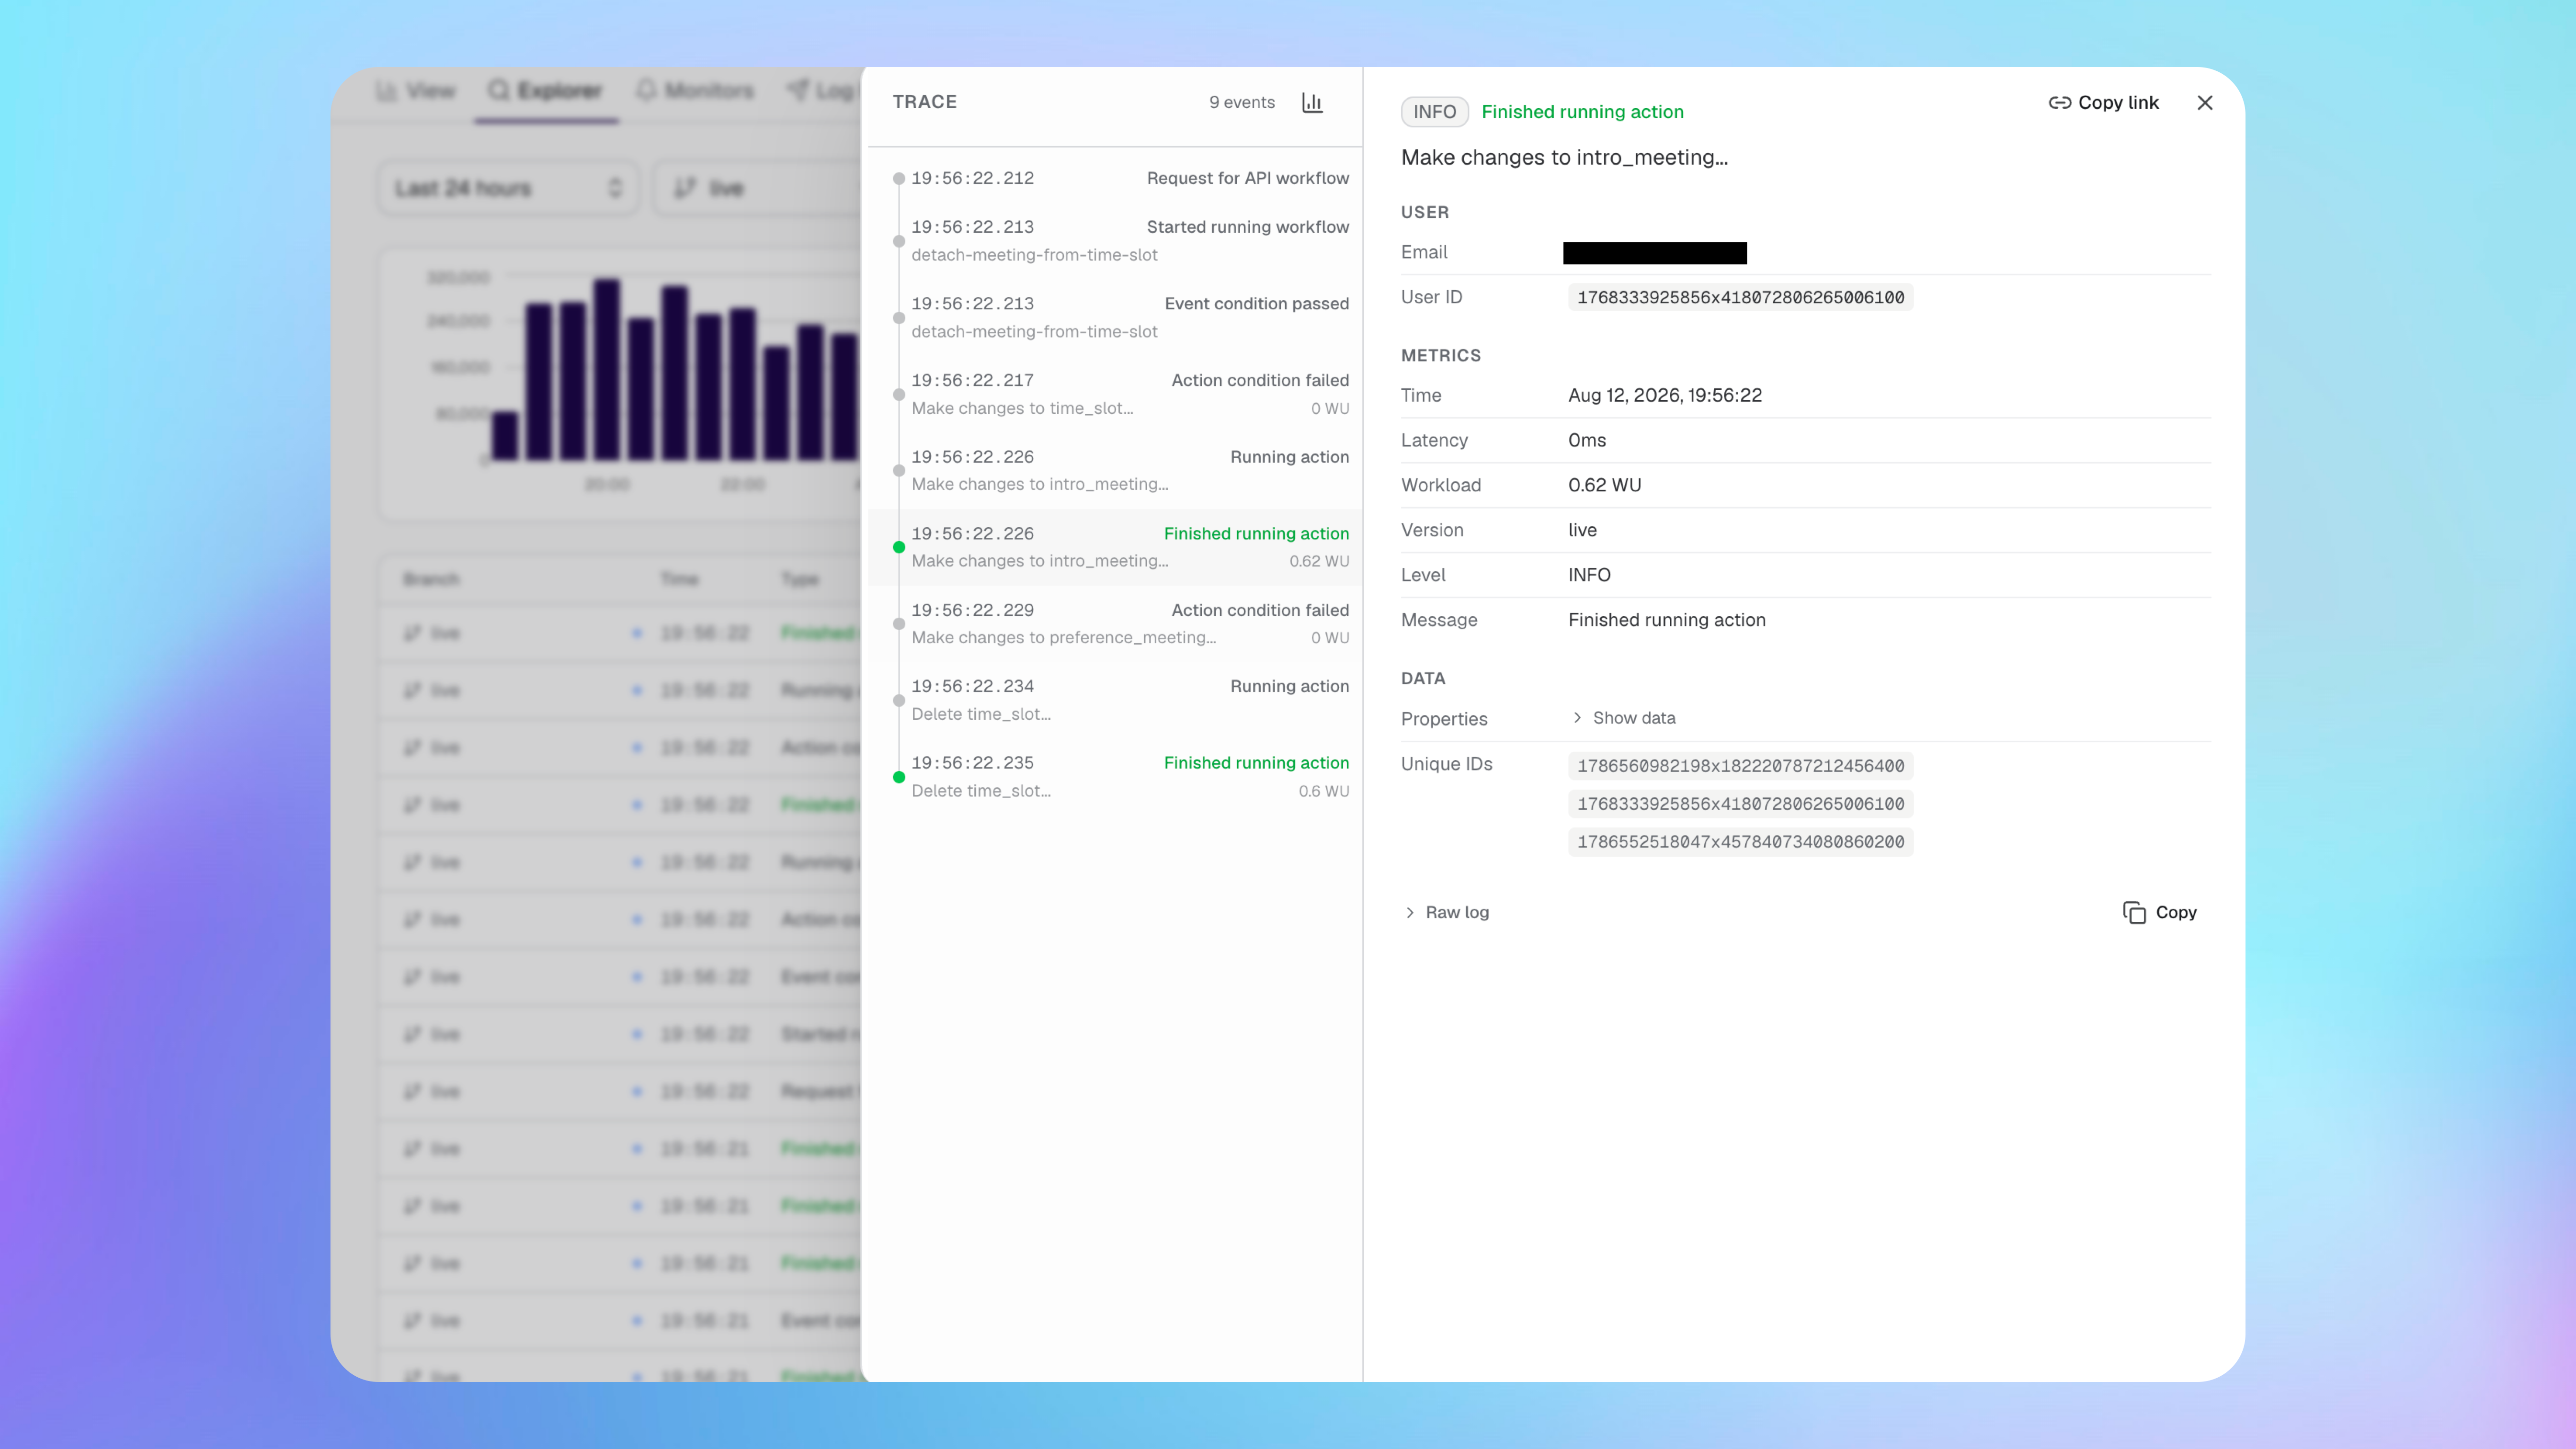
Click a result to open its details and related workflow trace.
The detail panel can include:
User and timestamp.
Bubble version and log level.
Latency and workload units.
Properties and request data.
Related Bubble unique IDs.
The complete raw log.
Use Copy link to share the event with a teammate. You can also copy the raw log when you need to inspect it elsewhere.
Follow a workflow trace
Buildprint groups events from one log into one trace.
Use the event list to follow the workflow in order. Switch to the waterfall to compare when actions ran and how long they took.
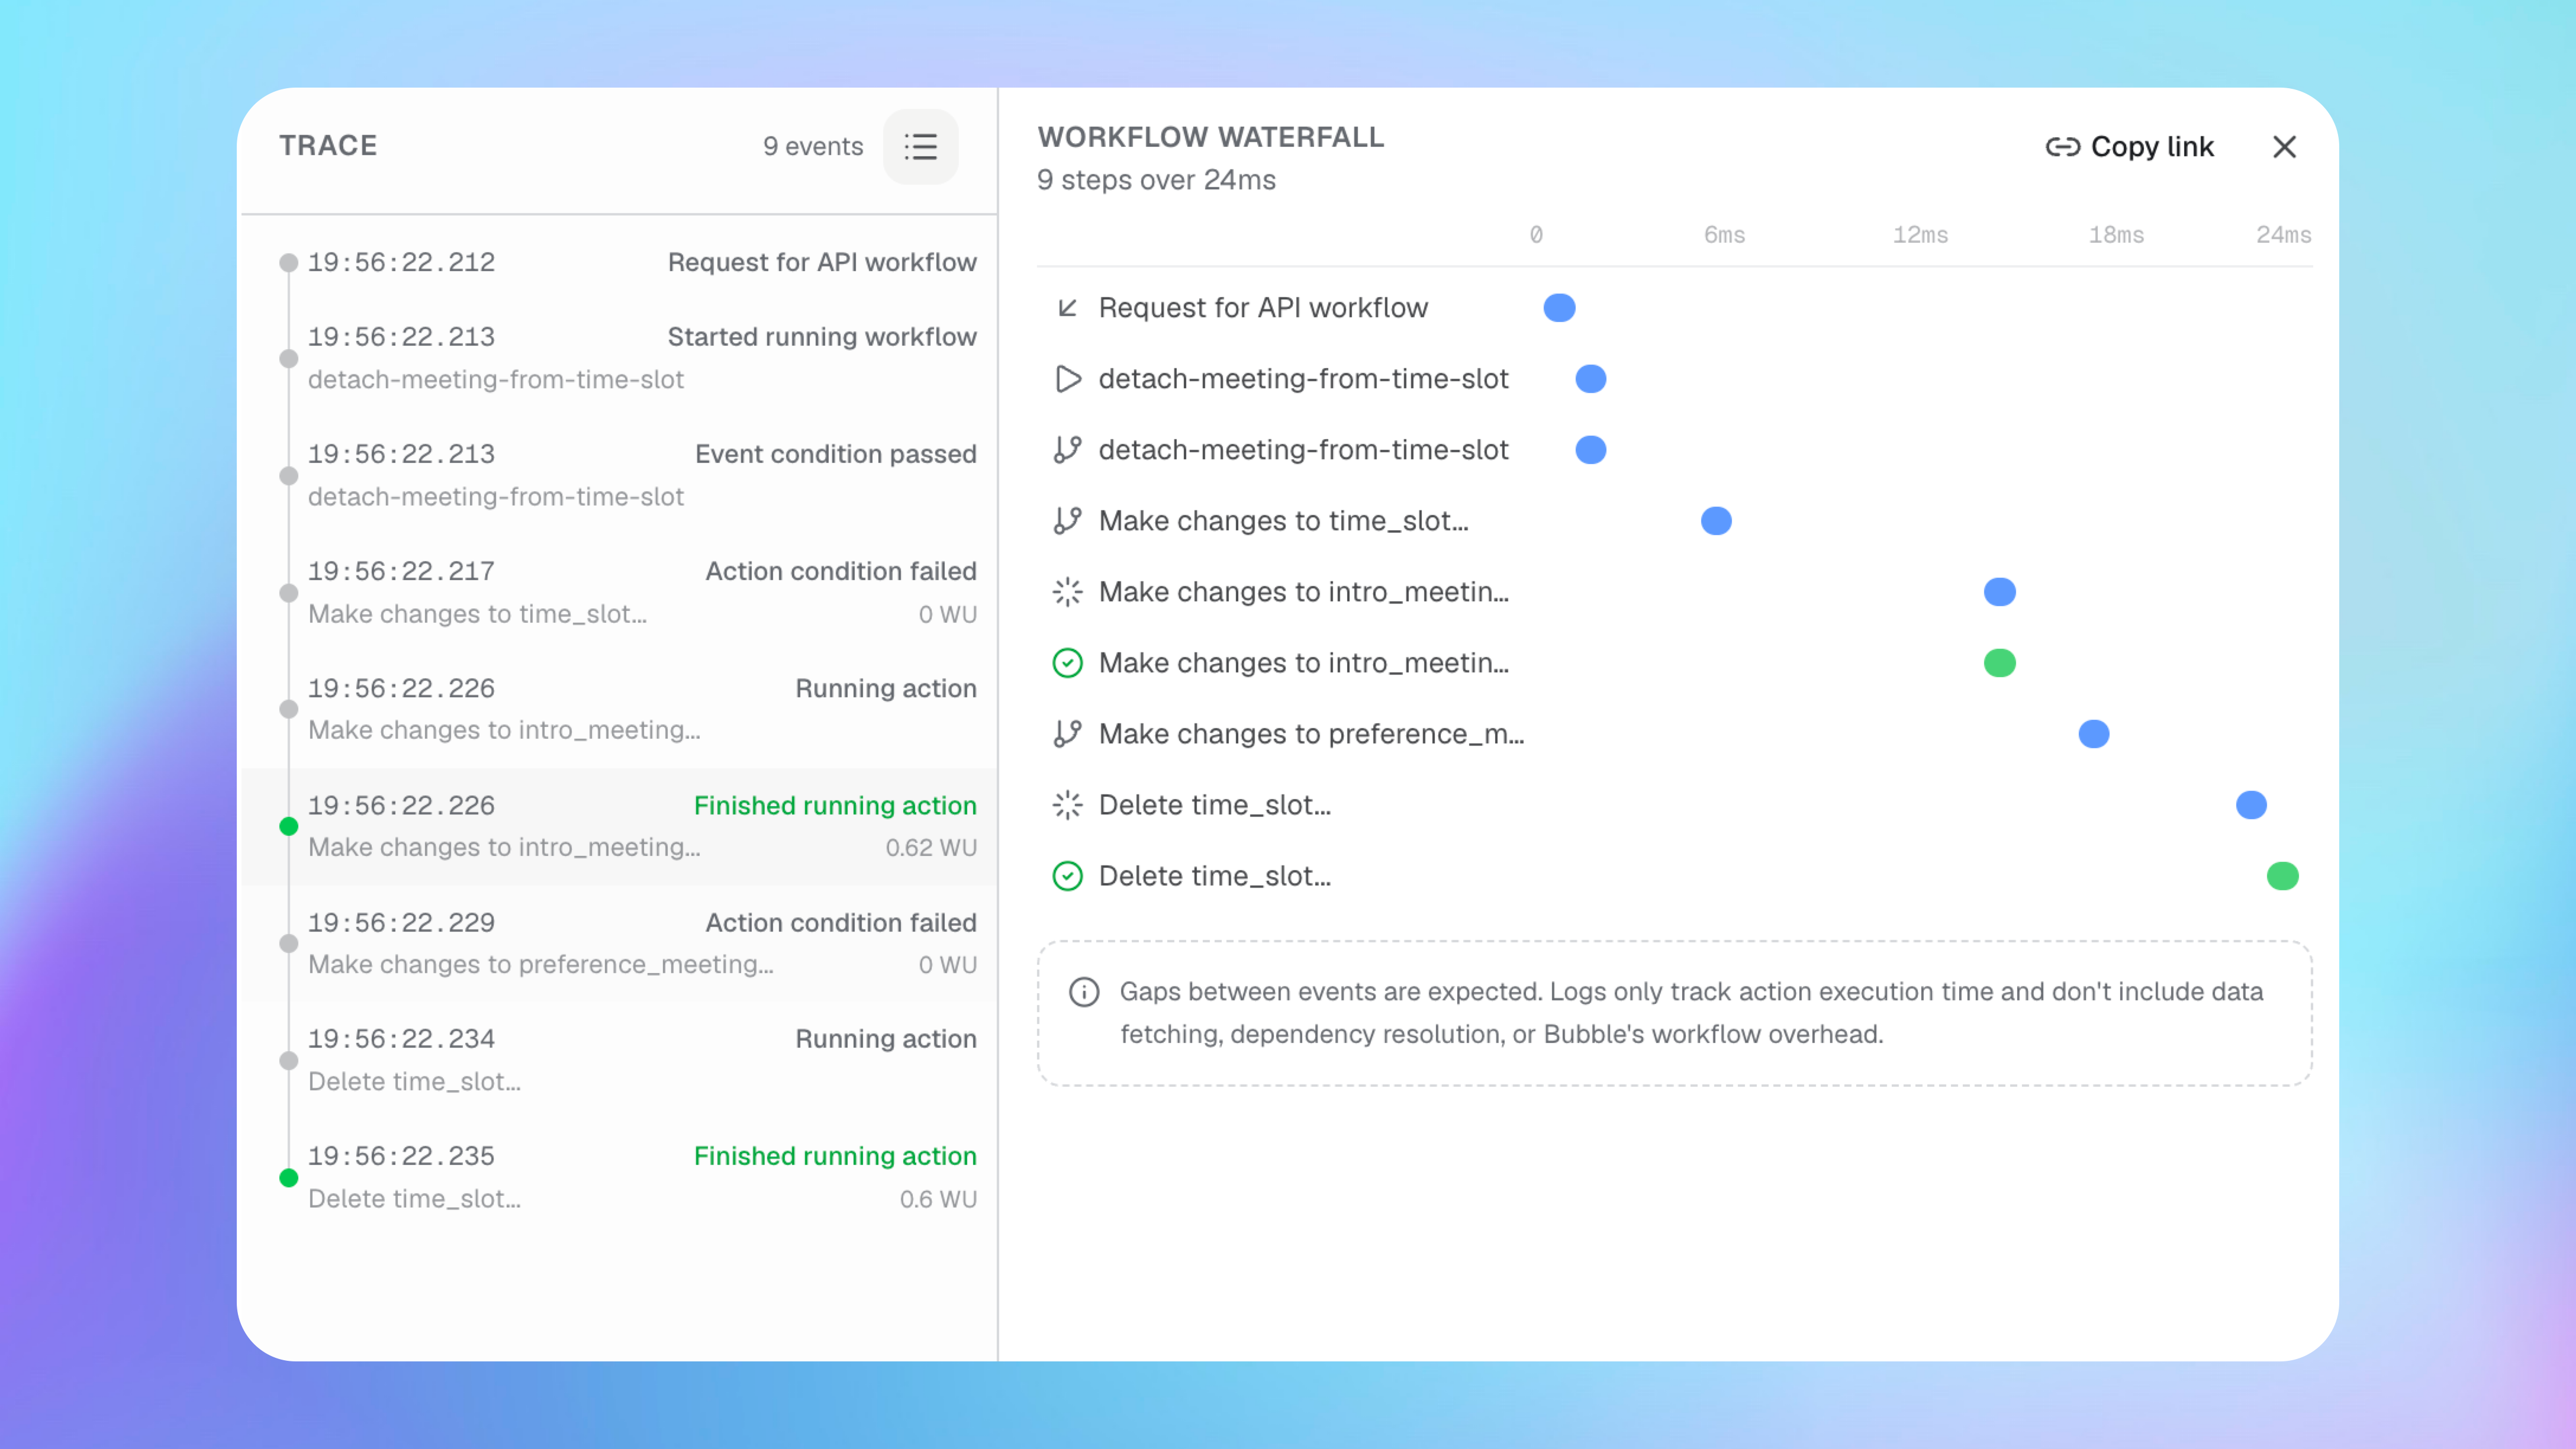
Gaps in the waterfall are expected. Bubble logs record action execution time, but do not include data fetching, dependency resolution, or Bubble’s other workflow overhead.
Troubleshooting
Explorer sends me back to View
No logs match my filters
Clear filters one at a time, check the selected Bubble version, and expand the time range.
A query fails
Refresh Explorer and try a smaller time range with fewer filters. Buildprint shows the query error when it cannot load results.
Was this helpful?
Was this helpful?